Return on Ad-Spend (RoAS) Dashboard
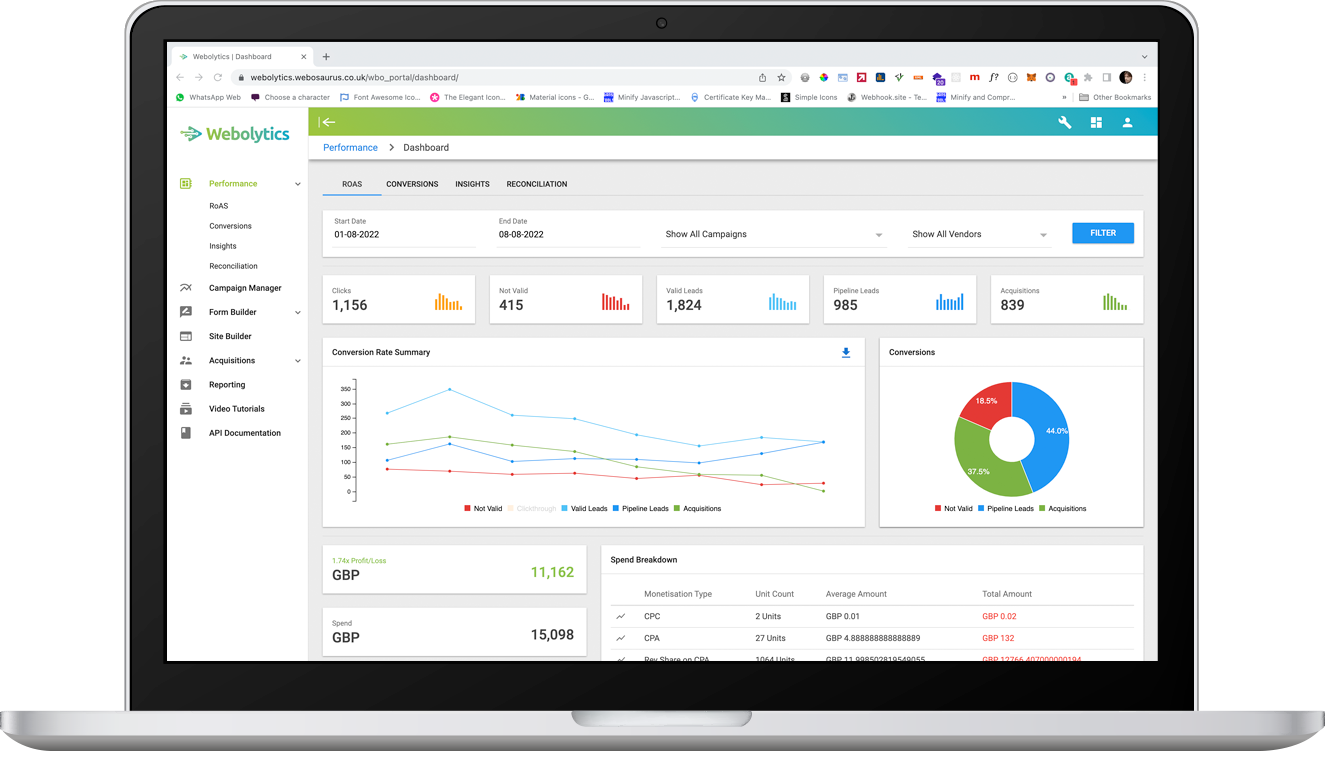
The RoAS (Return on Ad-Spend) section allows you to get a simple understanding of your current campaigns. You can filter the information by date, campaign and vendor.
The first thing you get to see on this page is the total number of clicks, not valid leads, valid leads, pipeline leads and acquisitions.
Below is a conversion rate summary. This shows your total interactions on each day in your filter range. The blue download button at the top allows you to download this information as a .csv file.
Here you can see your spend, revenue and profit/loss over your filtered timeframe. If you’re an affiliate, you will only see the net return.
A bar graph shows the daily profit/loss breakdown of your campaigns.
Finally, you can see which campaign is the most successful. You can sort by any of the table headers to assist you in fine tuning your campaign for best success. You can download all this information by clicking the download icon on the right.